

Human Resources Data and Third-Party Verification
Click here for the Third-Party Verification
| Number of Employees | Unit | 2019 | 2020 | 2021 | 2022 | 2023 | |
|---|---|---|---|---|---|---|---|
| Number of Employees - Global | Total | Headcount | 18,753 | 20,856 | 21,017 | 21,204 | |
| Female | Headcount | 4,871 | 5,271 | 5,324 | 5,302 | ||
| Ratio of female employees | % | 26.0% | 25.3% | 25.3% | 25.0% | ||
| Number of Employees - Japan | Total | Headcount | 9,960 | 9,776 | 9,440 | 9,219 | 9,265 |
| Female | Headcount | 1,478 | 1,458 | 1,417 | 1,390 | 1,396 | |
| Ratio of female employees | % | 14.8% | 14.9% | 15.0% | 15.1% | 15.1% | |
| Diversity, Equity & Inclusion | Unit | 2019 | 2020 | 2021 | 2022 | 2023 | |
| Employees by age - Global | 30 and younger | % | 12% | 13% | 14% | 14% | |
| 30~50 | % | 52% | 51% | 49% | 47% | ||
| Over 50 | % | 36% | 36% | 37% | 39% | ||
| Employees by age - Japan | 30 and younger | % | 5% | 5% | 6% | 7% | |
| 30~50 | % | 48% | 44% | 40% | 35% | ||
| Over 50 | % | 47% | 50% | 54% | 58% | ||
| Rate of employees in important positions outside of Japan*1 | Subsidiaries outside Japan | Companies | 26 | 26 | 26 | 47 | 46 |
| Managed by local staff | Companies | 14 | 15 | 18 | 35 | 36 | |
| Rate | % | 53.8% | 57.7% | 69.2% | 74.5% | 78.3% | |
| Rate of female members in leadership team - Global | Leadership team (Board of Directors, Executive members and auditors) | Headcount | 20 | 18 | 20 | 20 | 19 |
| Rate of female members | % | 10.0% | 5.6% | 10.0% | 20.0% | 21.1% | |
| Rate of female employees in managerial positions - Global | Total | Headcount | 3,336 | 3,451 | 3,814 | 4,026 | |
| Rate of female managers | % | 6.9% | 7.6% | 8.4% | 8.6% | ||
| Number of employees in managerial positions equivalent to senior managers - Global | Total | Headcount | 2,535 | 2,618 | 2,828 | 2,966 | |
| Rate of female senior managers | % | 7.4% | 7.8% | 8.6% | 8.9% | ||
| Rate of employees with disabilities - Global | % | 0.90% | 1.00% | 1.00%*2 | 0.91%*2 | ||
| Rate of employees with disabilities - Japan*3 | % | 2.20% | 2.30% | 2.28%*2 | 2.34%*2 | ||
| Recruitment and Retention | Unit | 2019 | 2020 | 2021 | 2022 | 2023 | |
| Number of new graduates hired - Global | Total | Headcount | 261 | 345 | 365 | 446 | 338 |
| Rate of female employees | % | 9.6% | 15.6% | 15.2% | 16.9% | ||
| Number of new graduates hired - Japan | Total | Headcount | 120 | 85 | 109 | 120 | 163 |
| Rate of female employees | % | 15.0% | 9.4% | 13.8% | 11.7% | 14.7% | |
| Number of mid-career recruitments - Global | Total | Headcount | 130 | 360 | 768 | 1,306 | 1,118 |
| Rate of female employees | % | 23.3% | 24.2% | 25.7% | 24.2% | ||
| Number of mid-career recruitment - Japan | Total | Headcount | 20 | 41 | 91 | 128 | 174 |
| Rate of female employees | % | 17.1% | 18.7% | 21.1% | 15.5% | ||
| Average years of service - Global | Average | Years | 19.7 | 17.5 | 17.2 | 17.2 | |
| Average years of service - Japan | Average | Years | 24.4 | 25.5 | 25.6 | 25.9 | 25.8 |
| Employee turnover rate - Global | Total turnover rate | % | 15.1% | 6.2% | 10.0% | 11.4% | 7.6% |
| Personal reasons (office staff) | % | 6.4% | 4.7% | 5.2% | 7.0% | 4.5% | |
| Personal reasons (factory staff) | % | 9.2% | 5.0% | 9.5% | 11.7% | 6.4% | |
| Employee turnover rate - Japan | Total turnover rate | % | 12.9% | 2.7% | 5.9% | 5.6% | 3.7% |
| Personal reasons (office staff) | % | 3.0% | 2.8% | 2.1% | 2.4% | 3.0% | |
| Personal reasons (factory staff) | % | 3.4% | 1.1% | 1.5% | 1.6% | 1.5% | |
| Compensation | Unit | 2019 | 2020 | 2021 | 2022 | 2023 | |
| Average annual salary of employees - Japan | Average salary | M yen | 7.7 | 7.9 | 8.8*2 | 8.7*2 | 8.9 |
| Average annual salary of managers - Japan*4 | Male | M yen | 10.2 | 10.4 | 11.6*2 | 11.8*2 | 11.9 |
| Female | M yen | 9.8 | 10.0 | 11.2*2 | 11.7*2 | 11.9 | |
| Average for female to male scale factor | Scale factor | 0.96 | 0.96 | 0.96*2 | 0.995*2 | 0.998 | |
| Talent Development | Unit | 2019 | 2020 | 2021 | 2022 | 2023 | |
| Training hours per employee - Global | Total | Hours | 7.7 | 9.7 | 12.8 | 15.1 | |
| Management | Hours | 8.5 | 10.8 | 11.6 | |||
| Non-management | Hours | 10.0 | 13.3 | 15.9 | |||
| Benefits & Programs | Unit | 2019 | 2020 | 2021 | 2022 | 2023 | |
| Average rate of annual paid leave acquired | Japan | % | 67.5% | 49.9% | 55.3%*2 | 63.8%*2 | 72.1% |
| Average number of days of annual paid leave acquired | Japan | Days | 16.8 | 12.4 | 13.7*2 | 15.6*2 | 17.6 |
| Number of employees using childcare leave | Japan | Headcount | 61 | 53 | 48*2 | 54*2 | 55 |
| Number of employees using spousal maternity leave | Japan | Headcount | 34 | 29 | 19*2 | 18*2 | 24 |
| Number of employees using short working hours for childcare | Japan | Headcount | 148 | 141 | 111*2 | 89*2 | 74 |
| Number of employees using family care leave | Japan | Headcount | 11 | 9 | 5*2 | 4*2 | 4 |
| Number of employees with side businesses | Japan | Headcount | 46*2 | 64*2 | 86 | ||
| Number of employees who select three to four unpaid day-off per week | Japan | Headcount | 12*2 | 16*2 | 17 | ||
| Temporary employee rate - Japan | Total*5 | Headcount | 902 | 868 | 1,228*2 | 1,361*2 | 1,161 |
| Rate | % | 9.1% | 8.9% | 13.0%*2 | 14.7%*2 | 12.5% | |
| Occupational Health and Safety | Unit | 2019 | 2020 | 2021 | 2022 | 2023 | |
| Rate of occurrence of occupational accidents with days away from work - Global Occurrence rate = number of incidents/number of employees (Excluding temporary/contract employees) | % | 0.08% | 0.06% | 0.09% | 0.08% | 0.03% | |
| Ref. Rate of occupational injury frequency - Japan Occupational injury frequency rate = Number of casualties due to occupational accidents (including number of casualties due to occupational accidents without lost workdays)/Total working hours x 1 million (Excluding temporary/contract employees) | - | 0.61 | 0.33 | ||||
| Number of occupational accidents with days away from work [regional] ( ) = cases of temporary/contract employees | Japan | Cases | 4 | 3 | 4 | 6 | 1(1) |
| US | Cases | 2 | 2 | 2 | 4(1) | 2 | |
| Europe | Cases | 7 | 3 | 4 | 5 | 1 | |
| Other Asia | Cases | 2 | 3 | 9(1) | 3 | 4(1) | |
| Number of occupational accidents with days away from work [by cause] ( ) = cases of temporary/contract employees | Fall | Cases | 4 | 4 | 6 | 8(1) | 3(1) |
| Improper movement | Cases | 2 | 2 | 1 | 3 | 1(1) | |
| Caught in between equipment | Cases | 2 | 0 | 0 | 0 | 0 | |
| Hit by or on something | Cases | 1 | 2 | 6(1) | 2 | 1 | |
| During commuting | Cases | 5 | 3 | 4 | 3 | 3 | |
| Others | Cases | 1 | 0 | 2 | 2 | 0 | |
| Respect for Human Rights and Labor Practices | Unit | 2019 | 2020 | 2021 | 2022 | 2023 | |
| Rate of manager training on bullying or harassment - Global | % | - | 87.2% | 97.7% | 90.1% | ||
| Rate of labor union members - Global | % | 63% | 62% | 54% | 53% | 52% | |
| Source of misconduct cases - Global | By Hotline | Cases | 1 | 0 | 0 | 2 | |
| By any other calling | Cases | 10 | 42 | 8 | 4 | ||
| By person concerned or supervisor | Cases | 10 | 30 | 7 | 86 | ||
| By company survey | Cases | 1 | 0 | 0 | 4 | ||
| Total | Cases | 22 | 72 | 15 | 96 | ||
| Detail of misconduct cases - Global ( ) = case of harassement | Violation of the law | Cases | 2 | 0 | 0 | 4 | |
| Violation of the company rule | Cases | 20 | 72 | 15(1) | 92(6) | ||
| Total | Cases | 22 | 72 | 15(1) | 96(6) | ||
| Actions for misconduct cases - Global | No action taken (includes cases where the employee resigned before the disposition was implemented) | Cases | 0 | 0 | 0 | 2 | |
| Alert | Cases | 14 | 47 | 12 | 12 | ||
| Disciplinary action | Cases | 8 | 25 | 3 | 82 | ||
| Total | Cases | 22 | 72 | 15 | 96 | ||
Unless otherwise specified, figures for the full year are shown for each subject fiscal year, and figures for the end of each subject fiscal year are shown for figures as of a certain point in time.
For Japan, employees of Renesas and domestic affiliates are included in the data.
FY2021 data includes employees of Dialog and excludes employees of Celeno.
*1 From FY2022, the number of overseas affiliates includes Dialog affiliates, and the definition of counting local numbers has changed.
*2 Items that do not include employees of Dialog.
*3 Figures as of June 1 of the subject fiscal year.
*4 Wages under Article 11 of the Labor Standards Law are included, and retirement and commuting allowances are excluded based on the Ministry of Health, Labor and Welfare's guide.
*5 Figures as of the date following the end of the fiscal year in question.
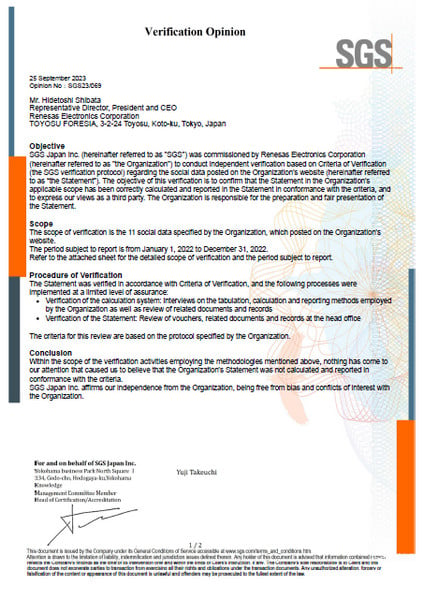
Third-Party Verification
Renesas Group receives third-party verification by SGS Japan Inc. in order to ensure the reliability of Human Resources data.
The scope of verification in 2022 (11 items):
Rate of employees in important positions outside of Japan / Rate of female employees in managerial positions / Rate of female employees in managerial positions equivalent to senior manager positions / Employee turnover rate / Rate of occurrence of occupational accidents with days away from work / Rate of employees with disabilities / Number of employees using childcare leave / Number of employees using spousal maternity leave / Number of employees using short working hours for childcare / Number of employees using nursing care leave / Average annual salary at management level and rate of female to male
Contributing to SDGs
Renesas’ efforts in Human Resources contributes to these Sustainable Development Goals targets:

SDG 8.5 By 2030, achieve full and productive employment and decent work for all women and men, including for young people and persons with disabilities, and equal pay for work of equal value